
BVDW study: Digital Economy generates €481 billion in gross value added
What we cannot measure, we cannot strengthen in a targeted way: for the first time, the Digital Economy in Germany has been mapped at the level of individual organisations. Using the AI-powered webAI approach of our partner ISTARI.AI, a ZEW spin-off, every company was classified by what it actually does rather than by its industry code. The report shows how large the Digital Economy really is, what it is made of and what it contributes to economic output.
Download Insights ReportToday, digitalisation shapes almost every area of economic activity. It is changing how companies produce, communicate and make decisions – and redefining the very foundations of value creation. Yet we still all too often look at the economy through an outdated lens: through rigid industry codes that barely reflect how companies actually work and create value.
This is precisely why the Digital Economy has so far remained largely invisible. It is not a single branch of the economy, but a new economic logic that shapes business models, value chains and markets far beyond the technology sector. With the study “Mapping the Digital Economy”, we are revealing its full scale for the first time – based not on formal industry classification, but on how important digital technologies really are to each company’s value creation.
Key findings at a glance
The Digital Economy is a key economic driver for Germany. It generates €481 billion – just under 12 per cent of Germany’s gross value added. At the same time, digital value creation extends far beyond the Digital Economy itself, exceeding one trillion euros. More than a quarter of gross value added is therefore digitally driven.
What exactly is the Digital Economy?
The first question, however, is how to define the Digital Economy and digital value creation in the first place.
For the first time, the study maps digital value creation as concentric circles around a digital core. The first two circles are the digital core economy, made up of companies whose products and services are themselves digital, and digitally driven business models, which could not function without digital technologies. Together, they form the Digital Economy and comprise around 229,000 companies. The third circle covers digitally transformed industries. Their core business is not digital, but their processes, products or business models are significantly changed by digital technologies.
The study thus establishes a common understanding. It is broadly based on the OECD’s multi-layer approach.
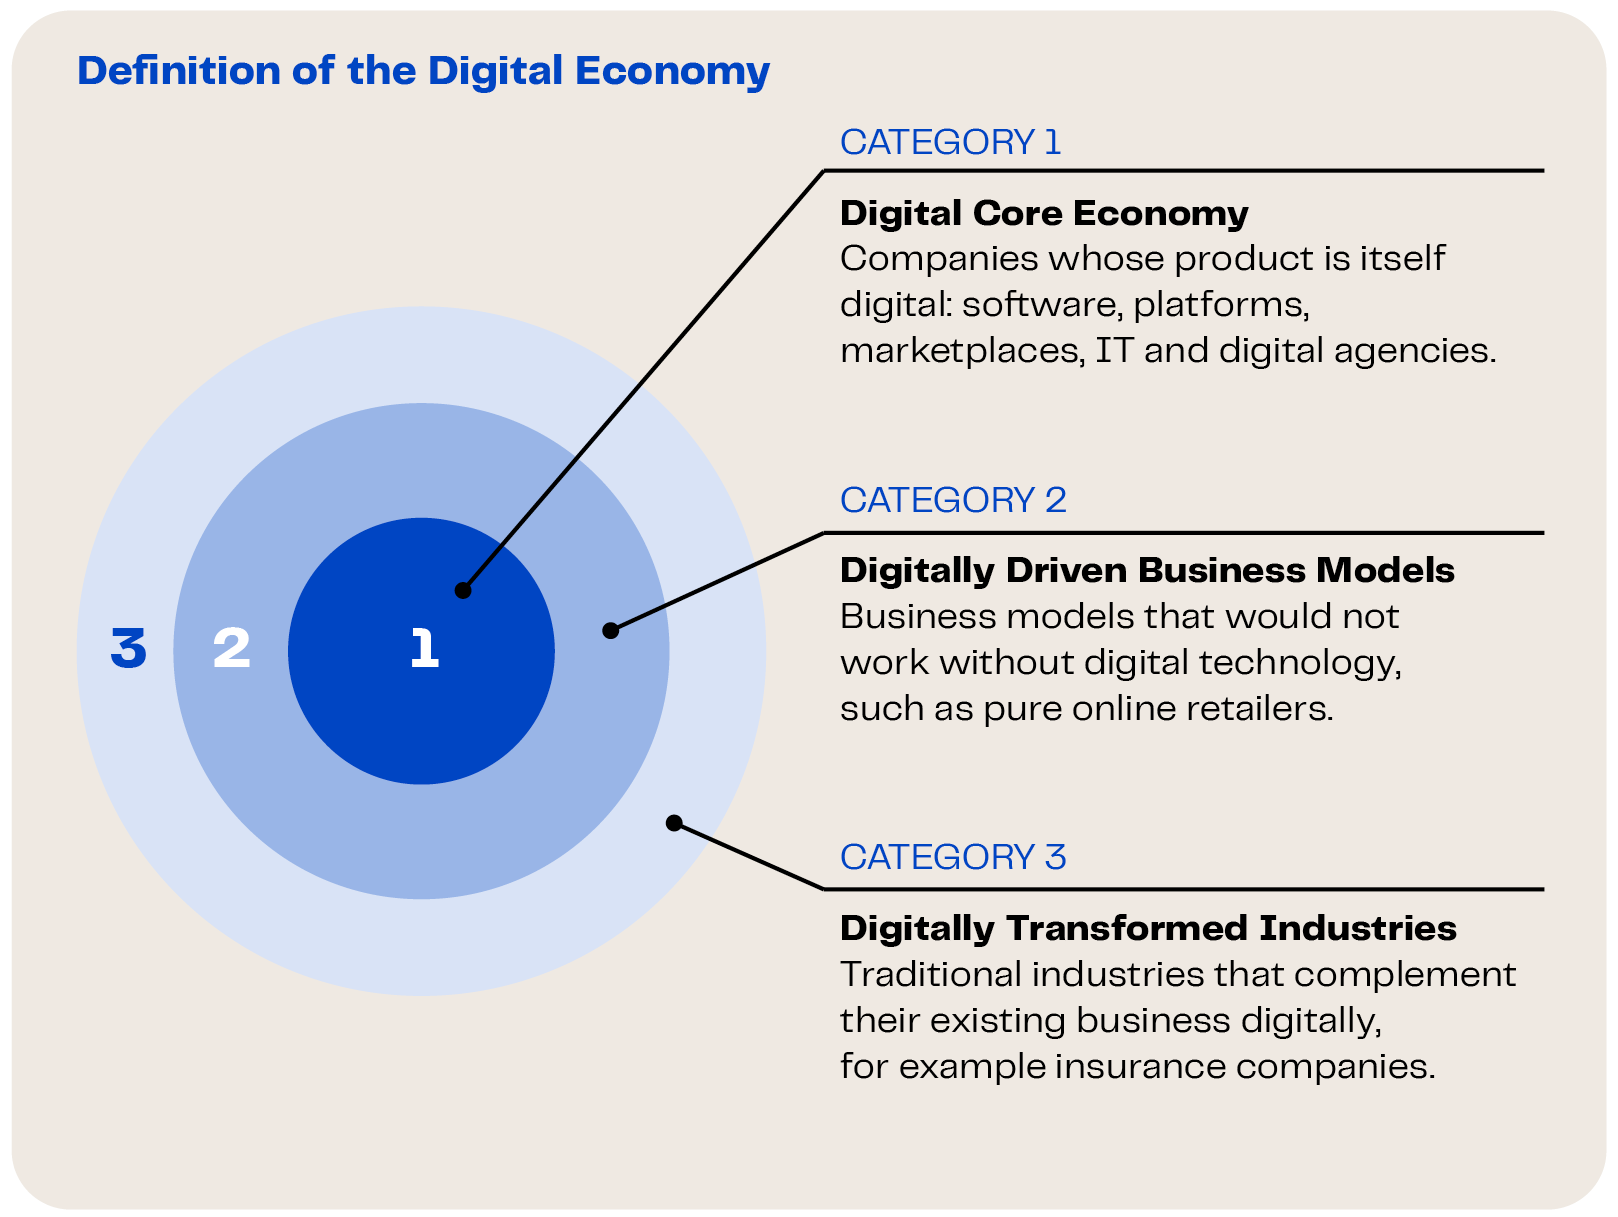
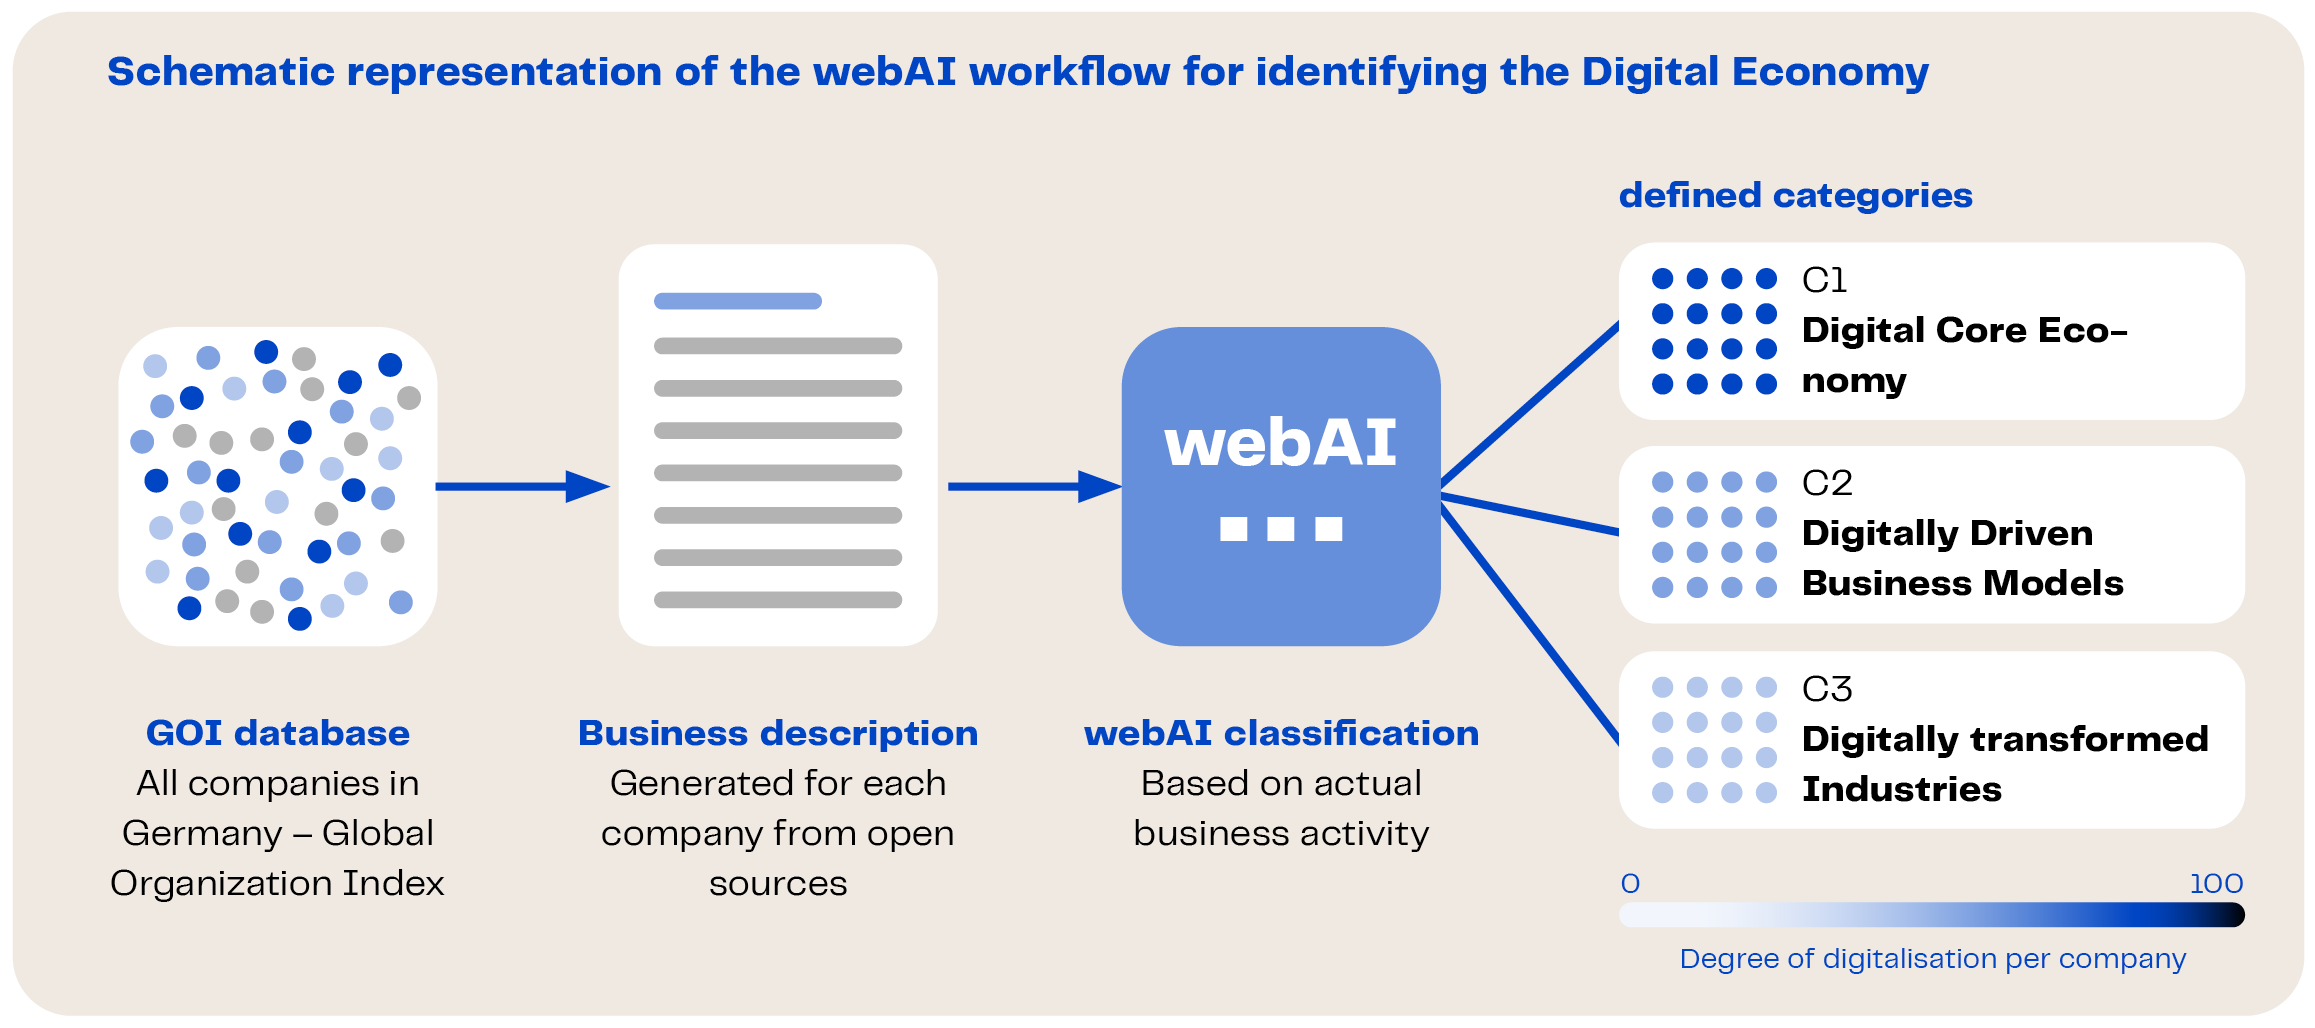
What makes this study innovative is that it does not measure the Digital Economy through existing statistical or industry classifications, but captures it directly through companies’ actual digital value creation. Instead of assigning companies to an industry across the board, the study examines what share of their economic output is really based on digital products, services, infrastructure or business models. This also brings to light digital value creation that often remains hidden in traditional economic statistics. For the first time, the study thus provides a nuanced and realistic mapping of the Digital Economy across industry and sector boundaries, creating a robust basis for economic and digital policy decisions.
Results in detail
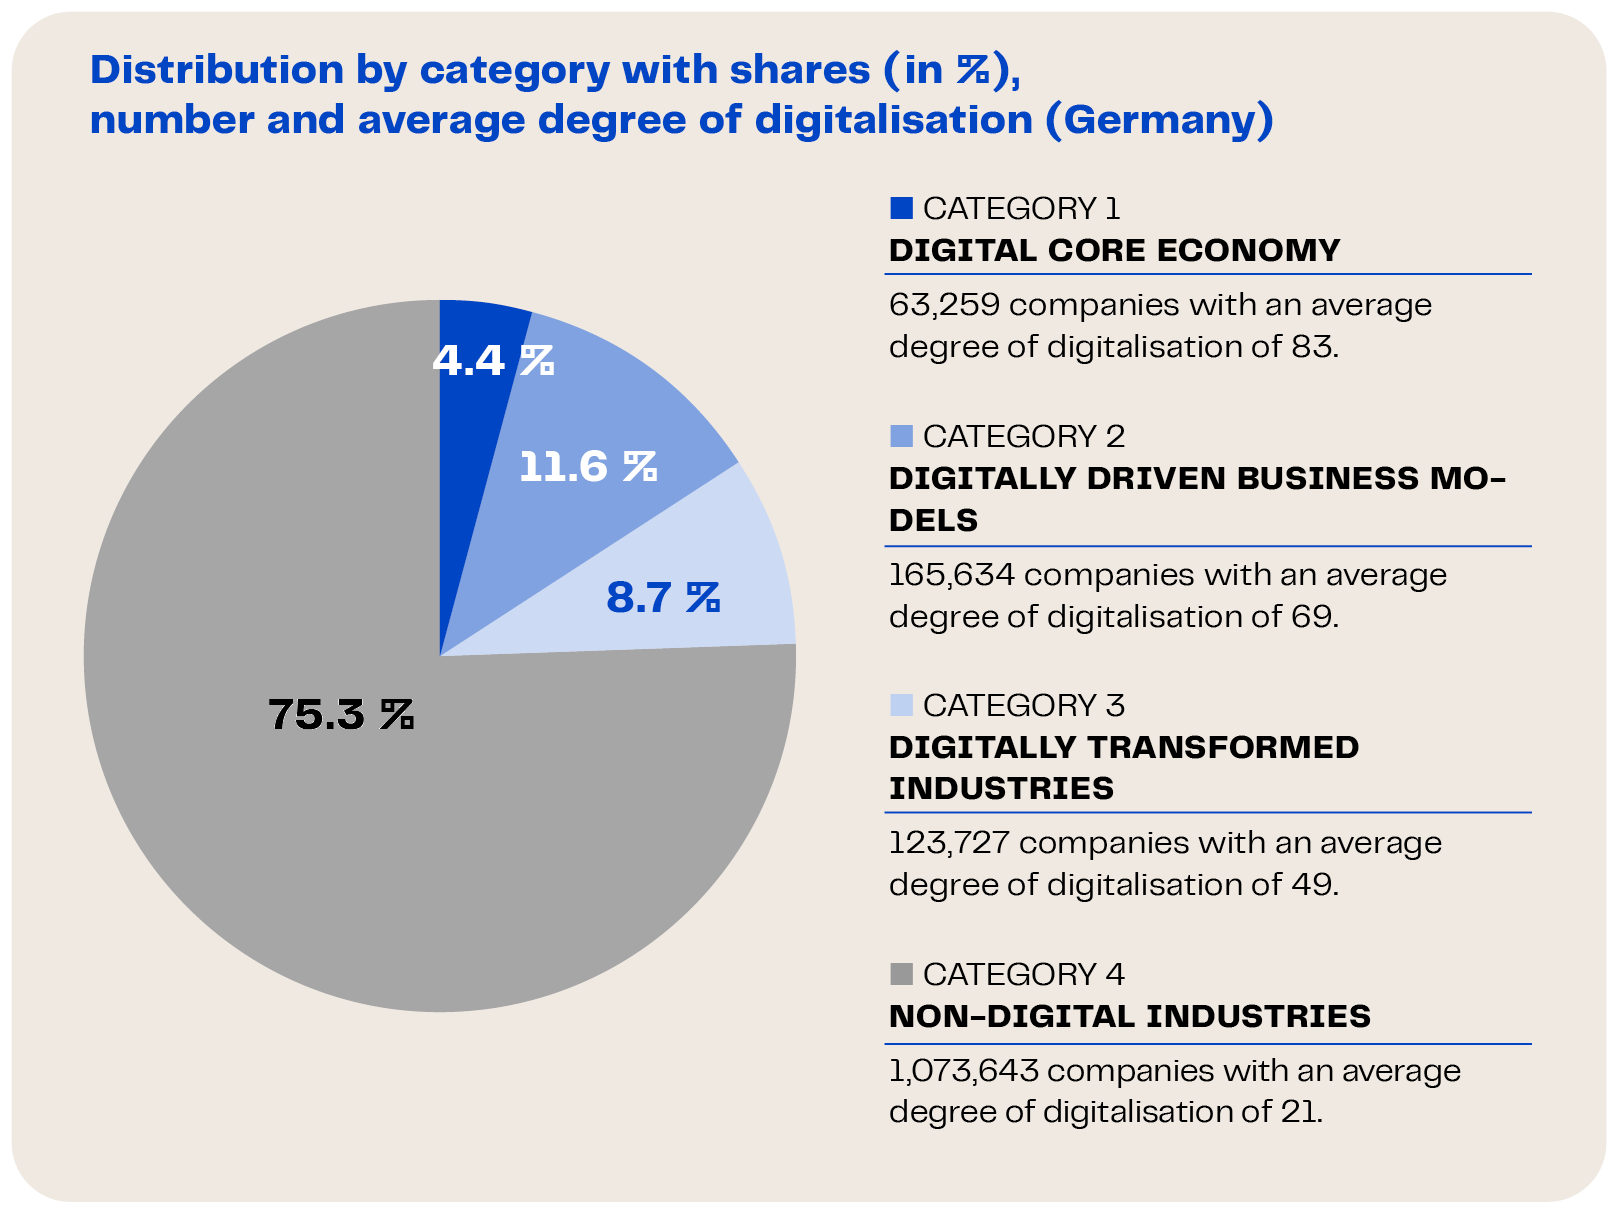
The key finding of the analysis: 24.7 per cent of all companies analysed fall into at least one of the three categories of the Digital Economy. The figure below shows how this share breaks down by category. The digital core economy accounts for 4.4 per cent (just under 63,000 companies), companies with digitally driven business models for 11.6 per cent (around 166,000 companies) and companies in digitally transformed industries for 8.7 per cent (roughly 124,000 companies). The further a category is from the digital core, the lower its average degree of digitalisation: it stands at 83 in the digital core economy, drops to 69 for digitally driven business models and 49 for digitally transformed industries, and reaches just 21 in the non-digital industries. This gradient confirms the inner logic of the circle model: the further out a category lies, the less weight digital technology carries in value creation on average.
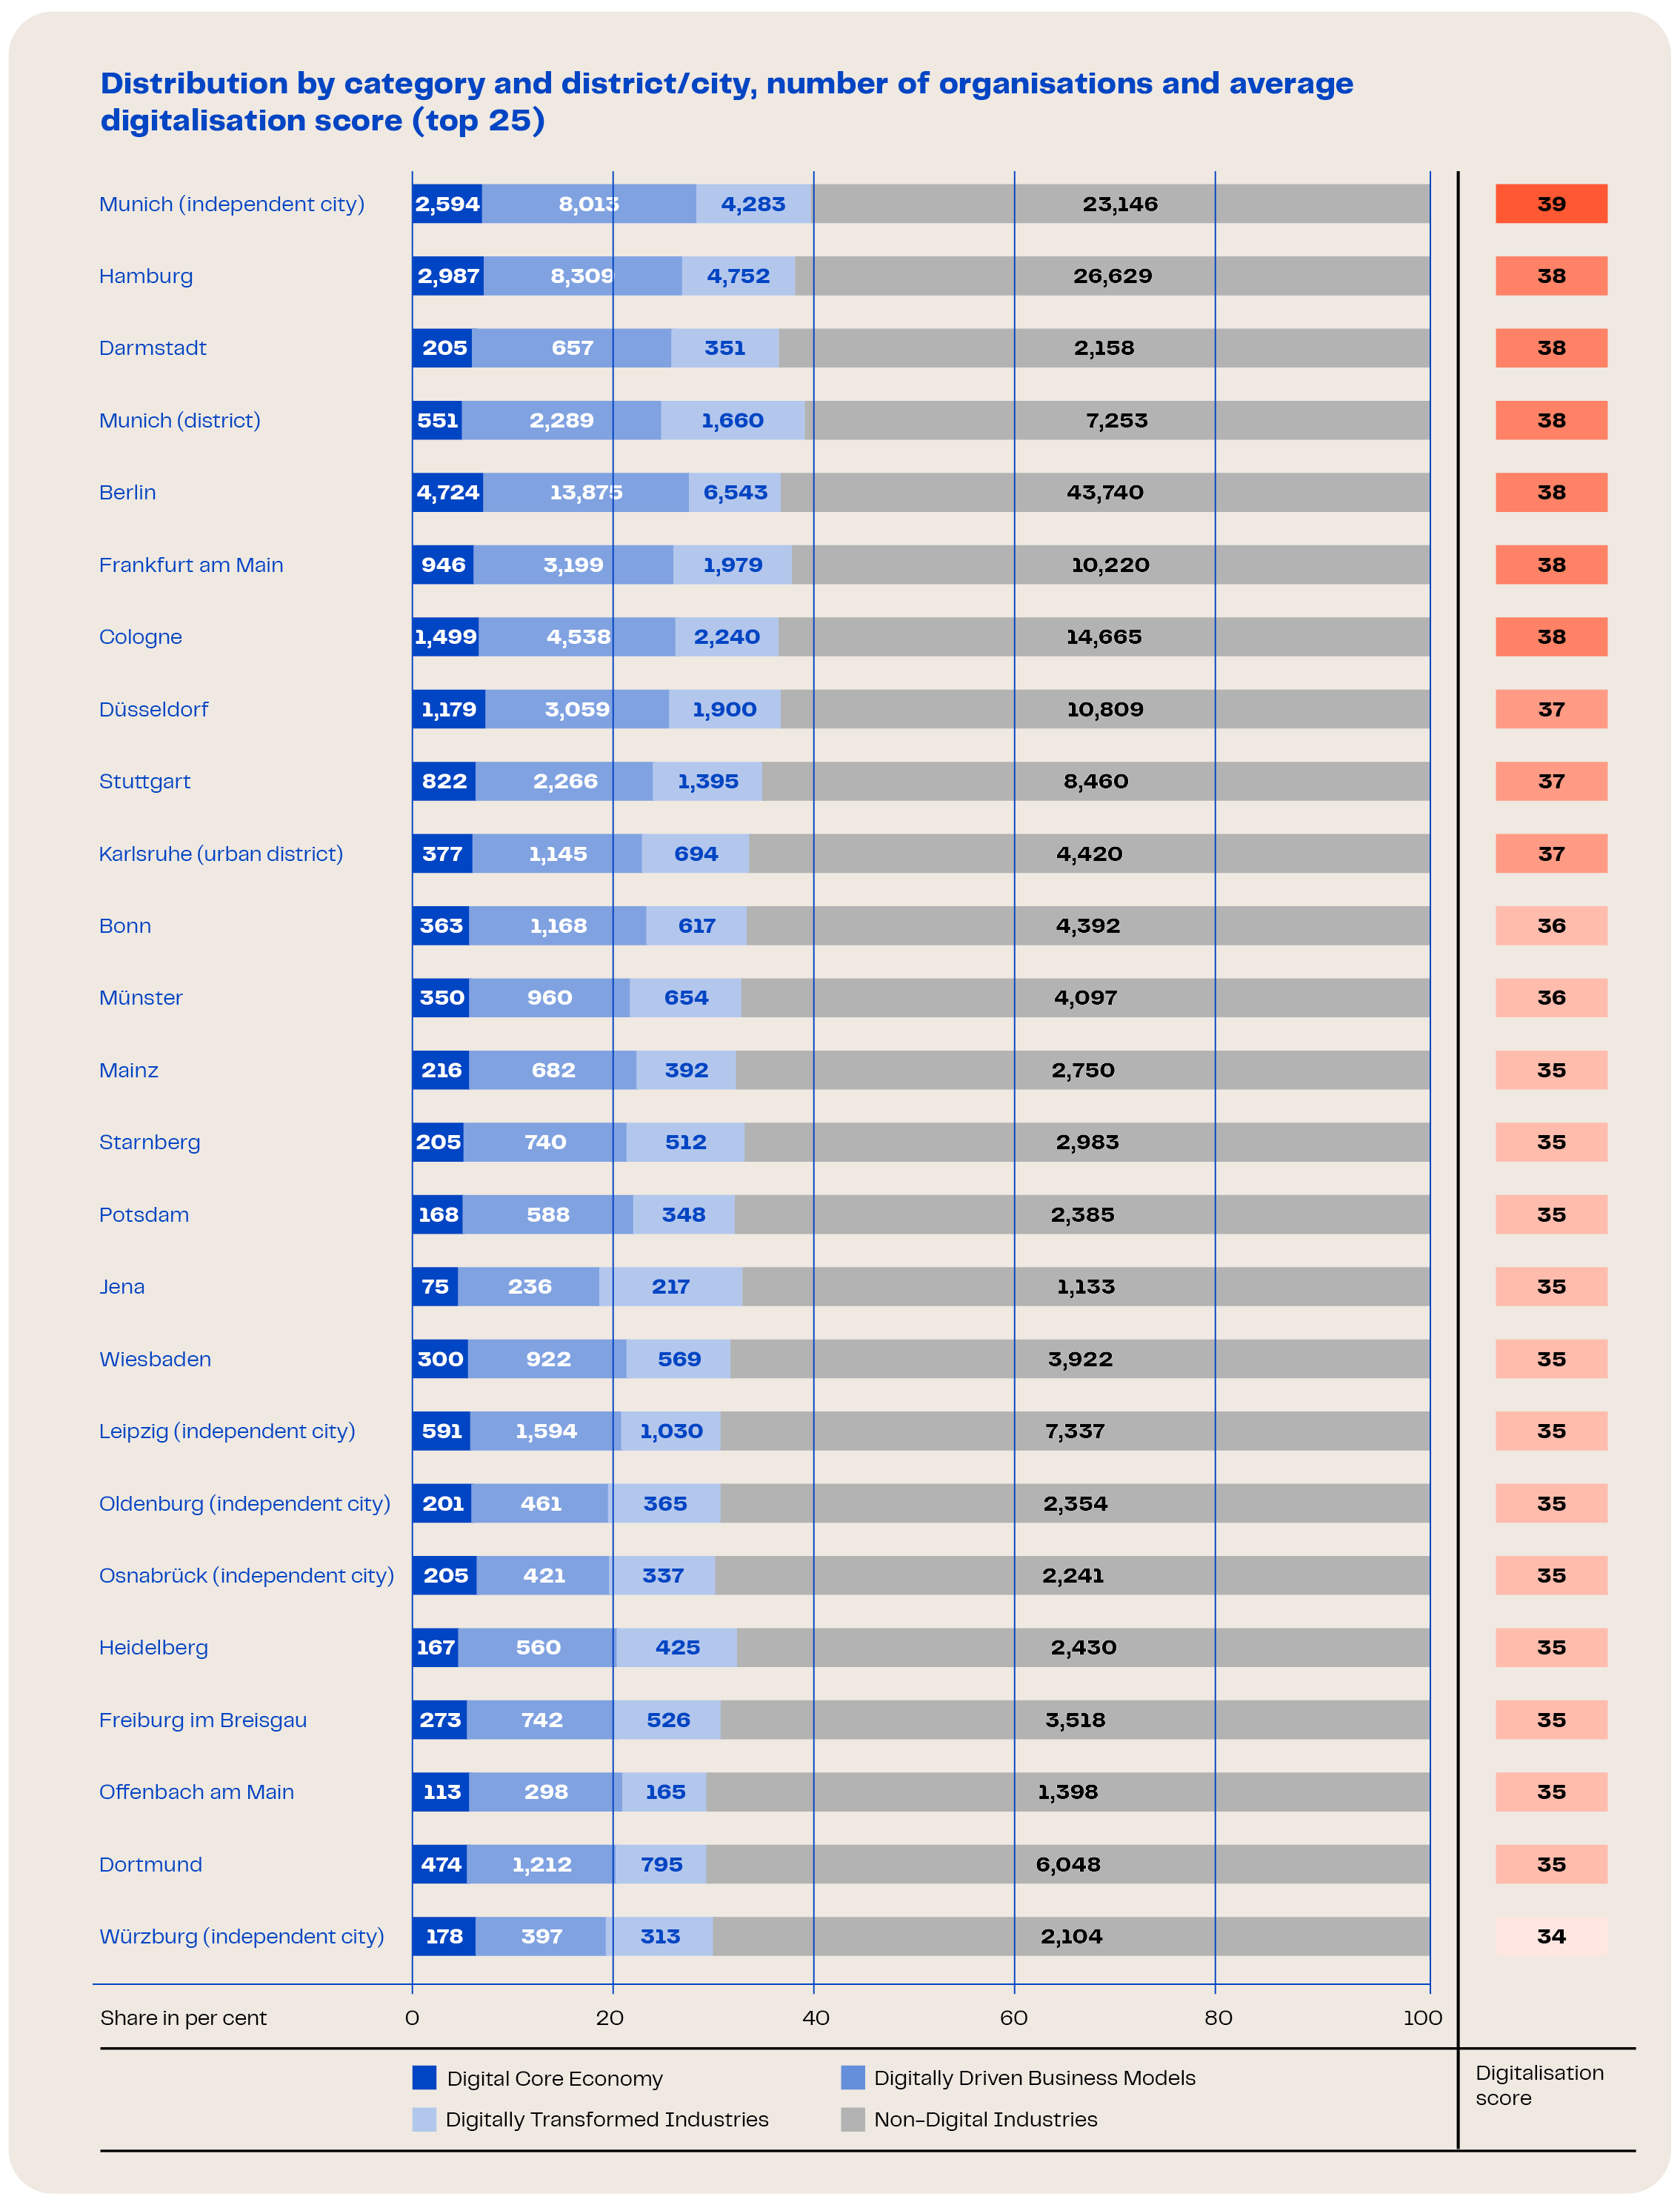
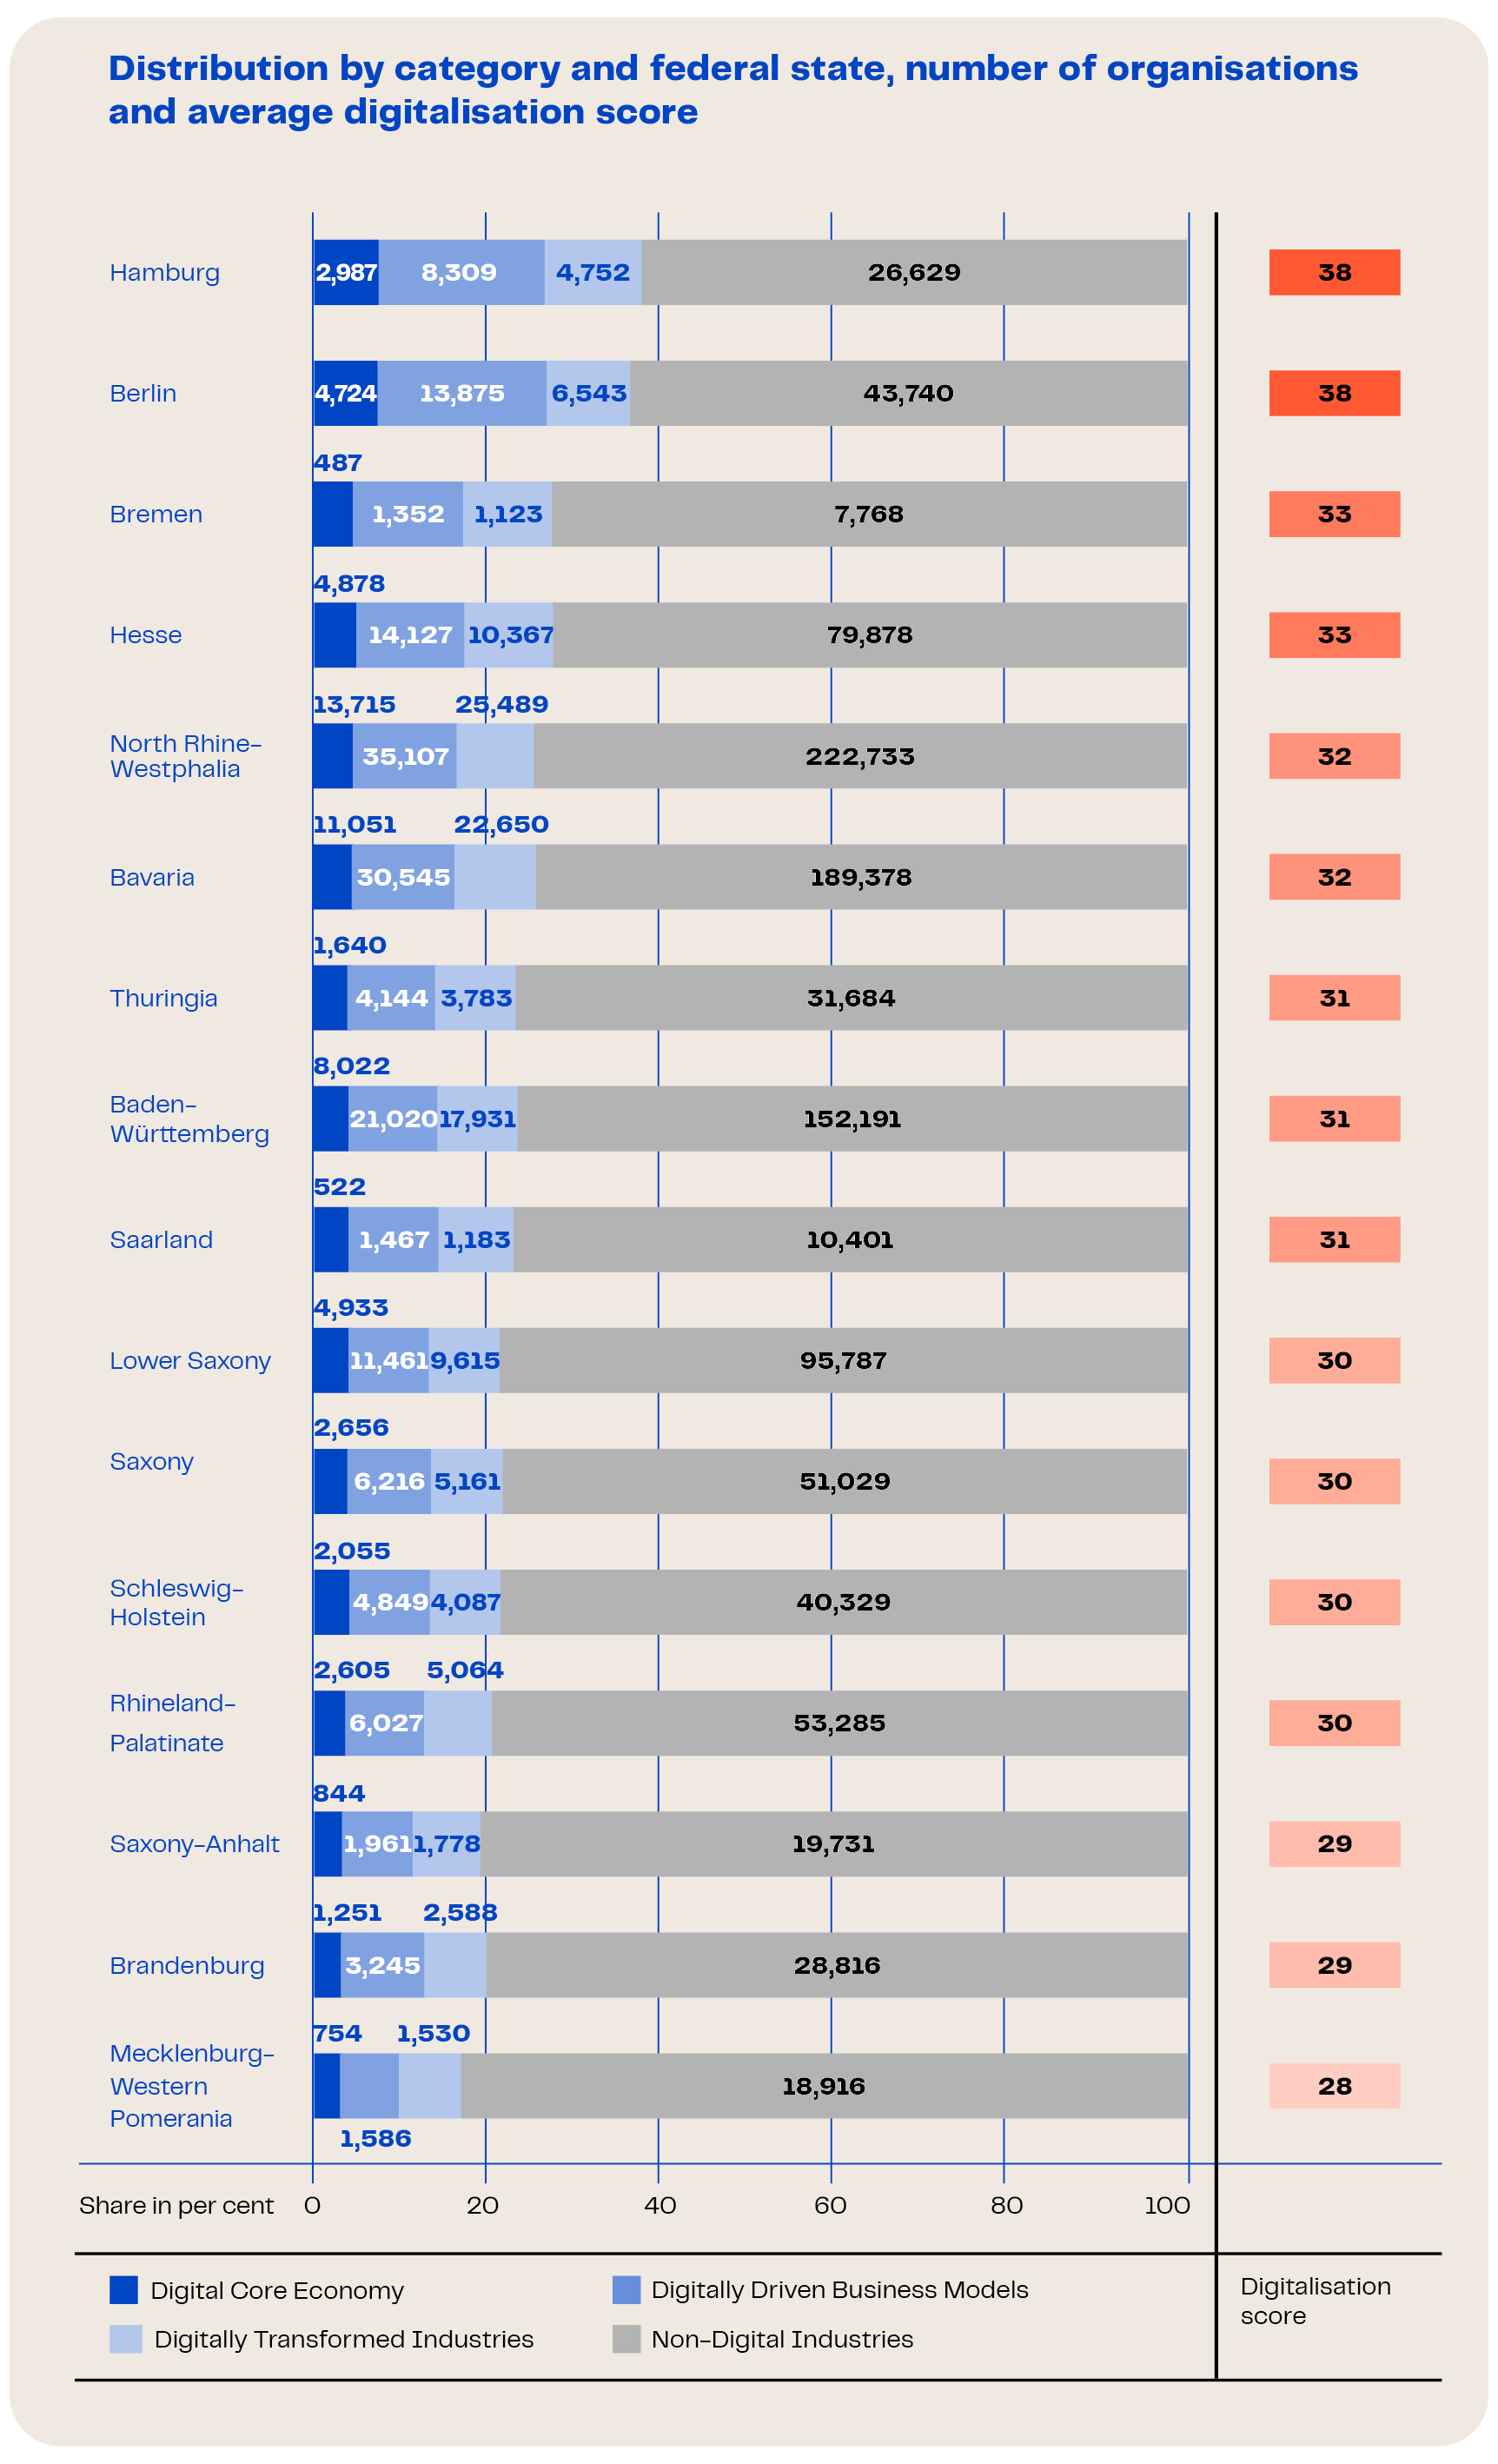
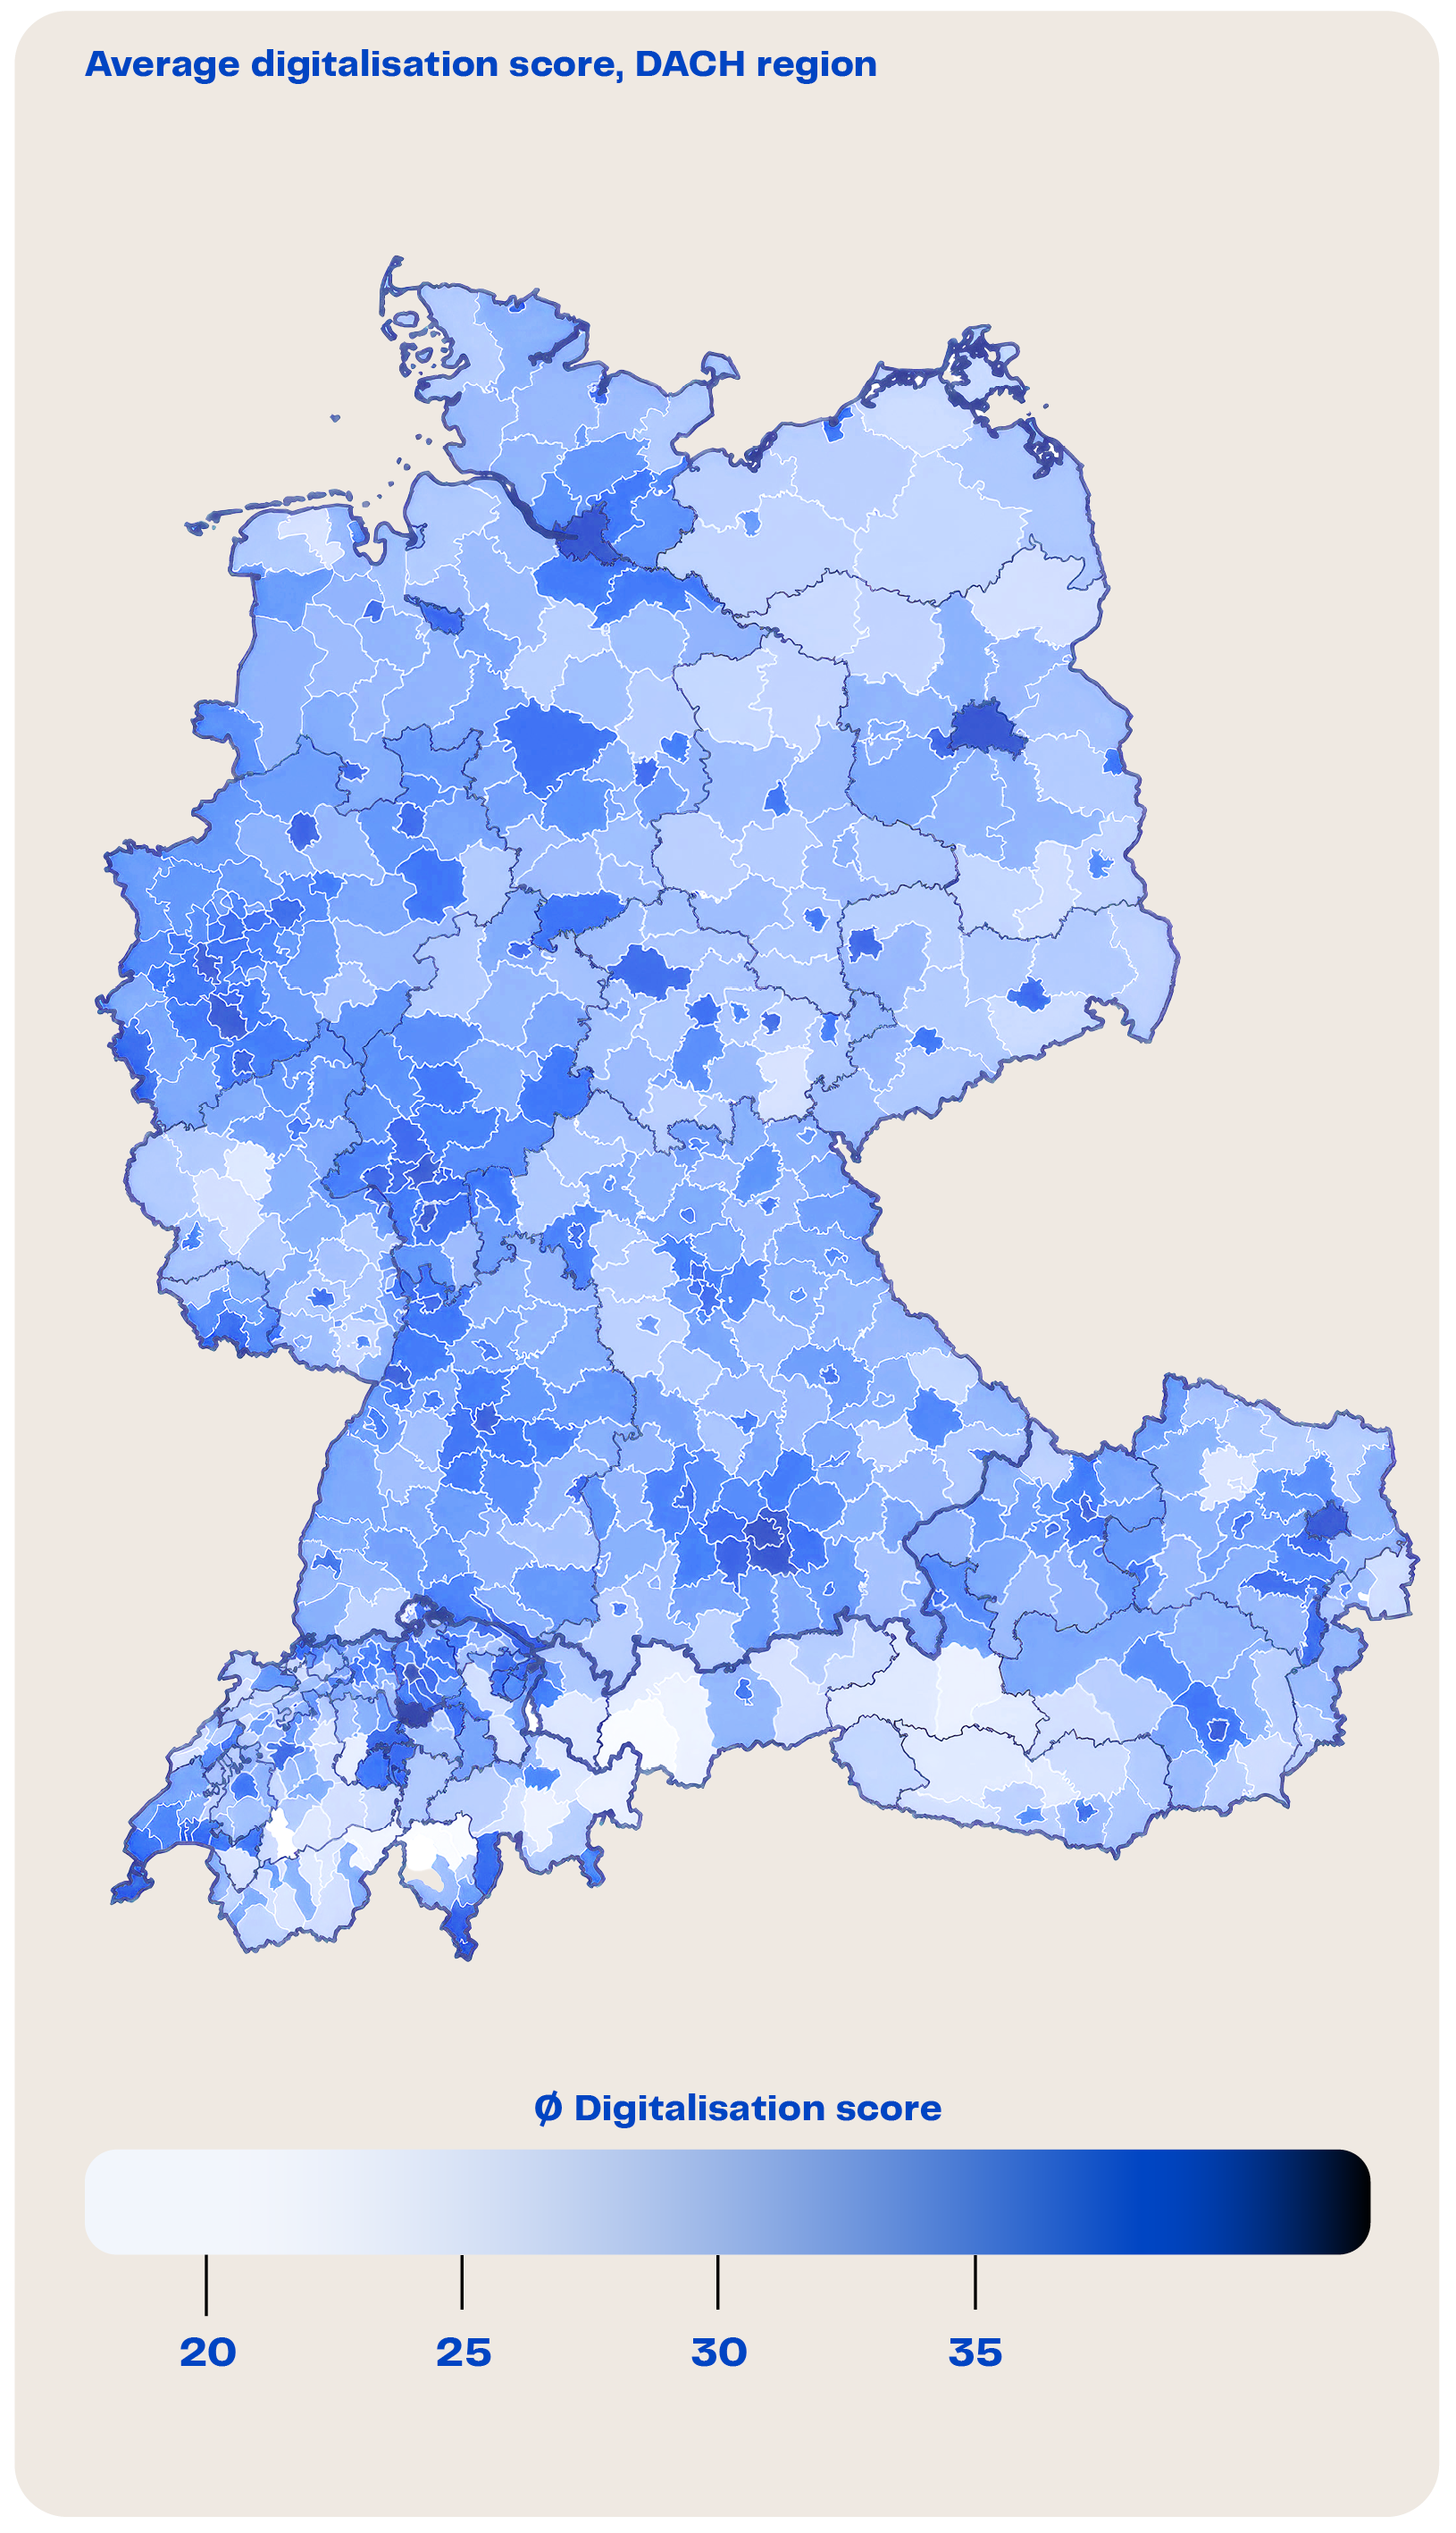
The regional analysis looks at two levels: rural districts and independent cities, and federal states. The map below shows the average degree of digitalisation for each district and city. Marked regional differences are visible at a glance. High degrees of digitalisation are concentrated in cities, with the highest averages in Munich, Hamburg, Darmstadt, Berlin and Frankfurt am Main. Low scores, combined with a small share of Digital Economy companies, are found mainly in rural regions such as Cochem-Zell, Saale-Orla-Kreis, Wittmund, Uckermark and Bernkastel-Wittlich. While the Digital Economy’s share in these regions is only slightly above 10 per cent, it reaches almost 40 per cent in the cities mentioned. Remarkably, the internal composition hardly varies between regions: the balance between the digital core economy, digitally driven business models and digitally transformed industries remains largely stable. Regions therefore differ in the size of their Digital Economy, not in its structure. The same pattern holds at federal state level. The city states of Hamburg, Berlin and Bremen lead the ranking, with the highest average degree of digitalisation and the highest shares of Digital Economy companies. Structurally weaker, largely rural states such as Mecklenburg-Western Pomerania, Brandenburg, Saxony-Anhalt and Rhineland-Palatinate come last. The differences between federal states are, however, smaller than between districts, as urban and rural areas within the larger states balance each other out.
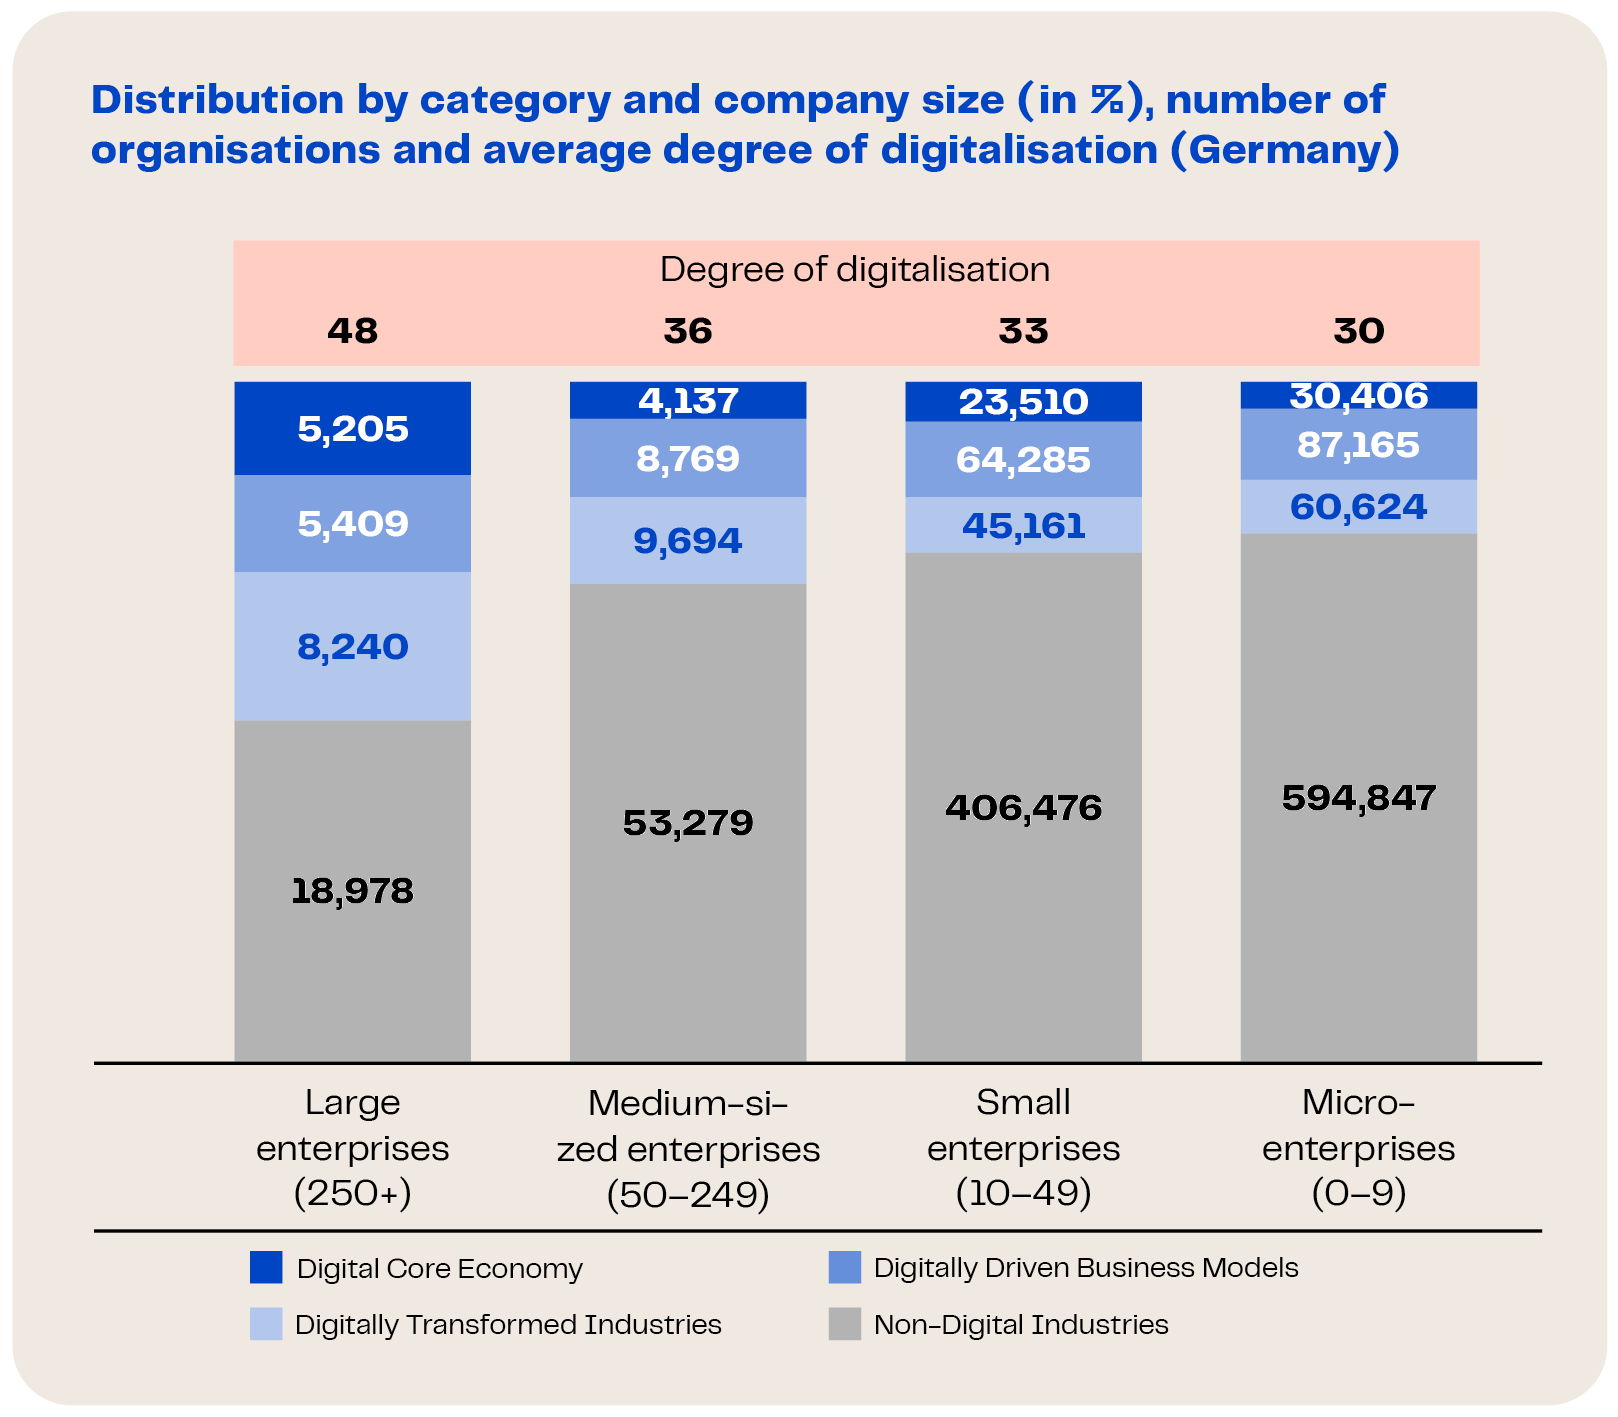
This figure shows the category distribution by company size in per cent. One thing is clear: the larger the company, the higher the share of the Digital Economy. For micro, small and medium-sized enterprises, it ranges from around 22 to 30 per cent, while for large enterprises with 250 or more employees it is just under 50 per cent. However, this should not obscure the absolute numbers: in terms of sheer numbers, the Digital Economy consists mainly of small companies. The digitally transformed industries alone include just under 61,000 micro-enterprises with up to nine employees, but only around 8,250 large enterprises with 250 or more employees. The higher share among large enterprises therefore does not mean that the Digital Economy consists mainly of large companies, but rather that digital business activity is more common among them. The average degree of digitalisation by size class points in the same direction, rising steadily from 30 for micro-enterprises to 48 for large enterprises.
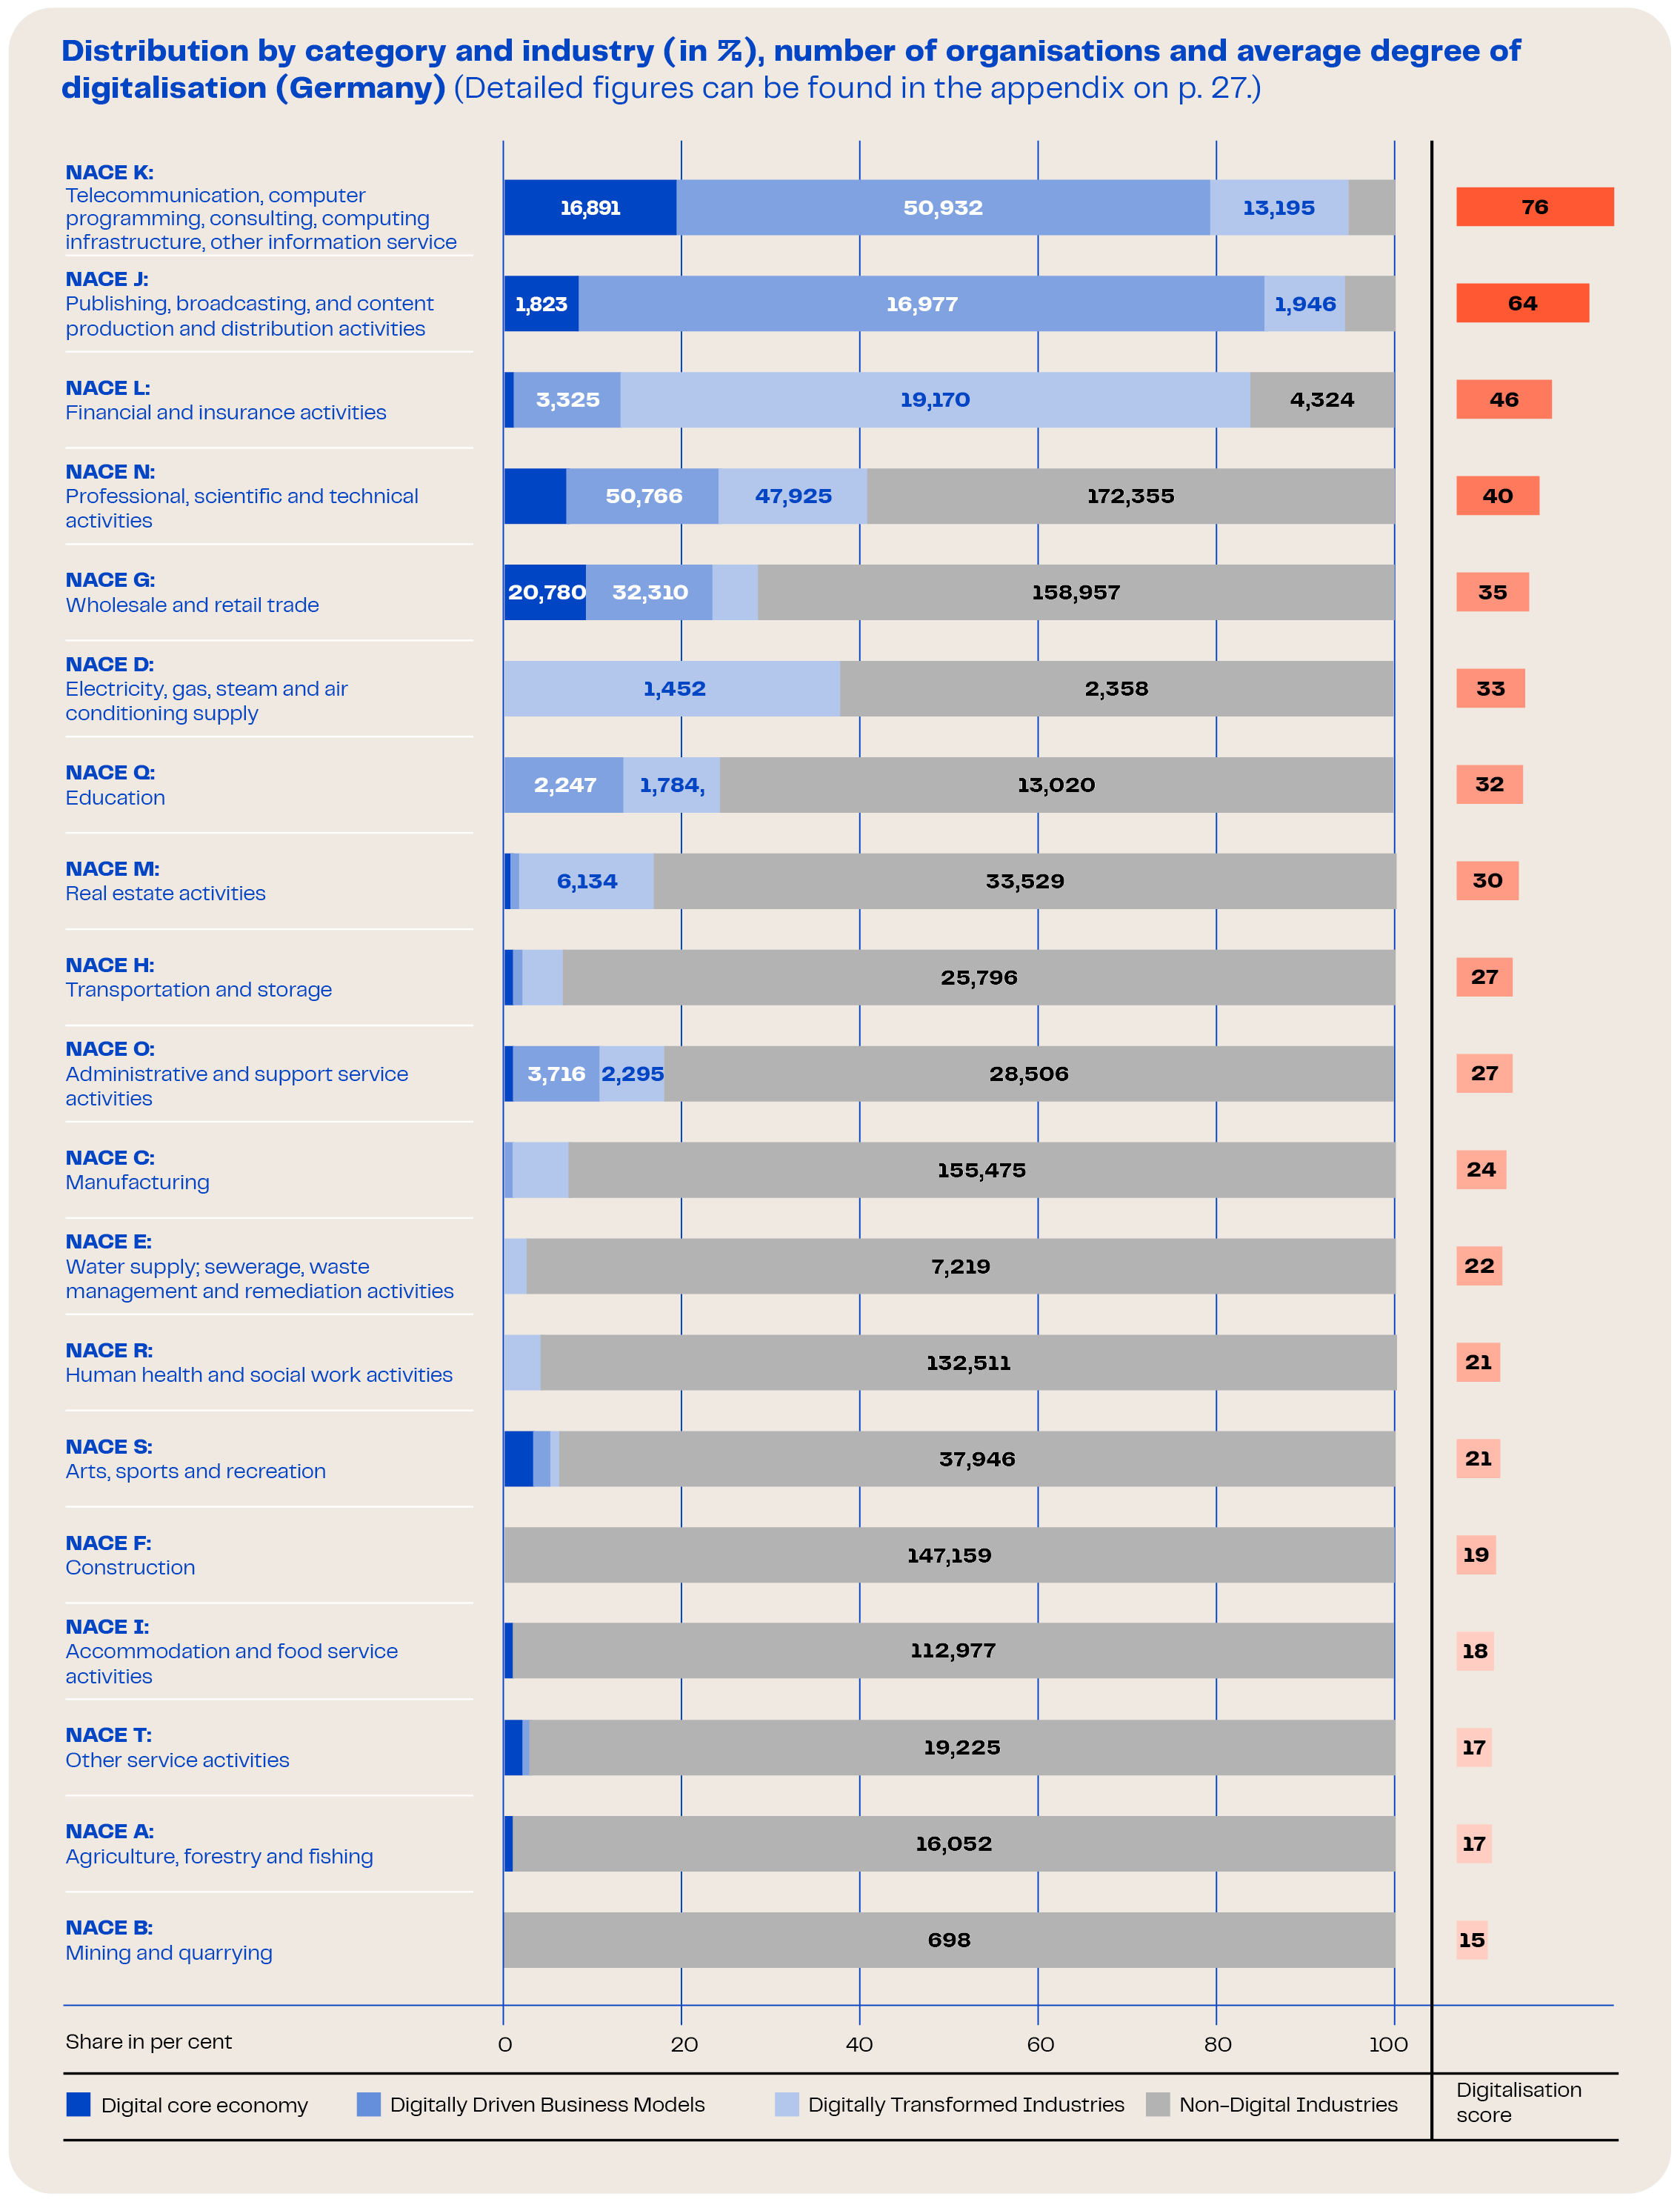
The figure below shows the category distribution by industry (NACE codes), ranked by average degree of digitalisation. Section K (including telecommunications and computer programming) and Section J (including publishing) score by far the highest, followed by Section L (financial and insurance activities). These three industries also have by far the highest share of companies belonging to at least one category of the Digital Economy (between 80 and over 90 per cent). At the bottom are industries with little exposure to digitalisation, such as agriculture and forestry or mining, with very low shares. Notably, the make-up of the Digital Economy can vary widely from one industry to another. A high overall share does not automatically mean a correspondingly high share of the digital core economy. Section D (energy supply), for example, reaches a high overall share of just under 40 per cent, but this comes almost entirely from the digitally transformed industries category – the outermost circle of the Digital Economy. The same applies to Section L, whereas Section K has not only a high overall share of Digital Economy companies but also a high share of the digital core economy: almost 20 per cent of companies in this industry belong to the digital core. Overall, the Digital Economy is very unevenly distributed across industries. The next figure presents total employment and category composition by NACE industry and size class as a mosaic chart: the area of each tile represents total employment for the given combination of industry and size class, while the colours show the Digital Economy’s share of that employment. This highlights how much each industry and size class matters in terms of employment. It shows that a large part of Digital Economy employment is in Section K, concentrated among large companies: large enterprises in this section employ just under three million people, while micro-enterprises in the same section employ only around 110,000.
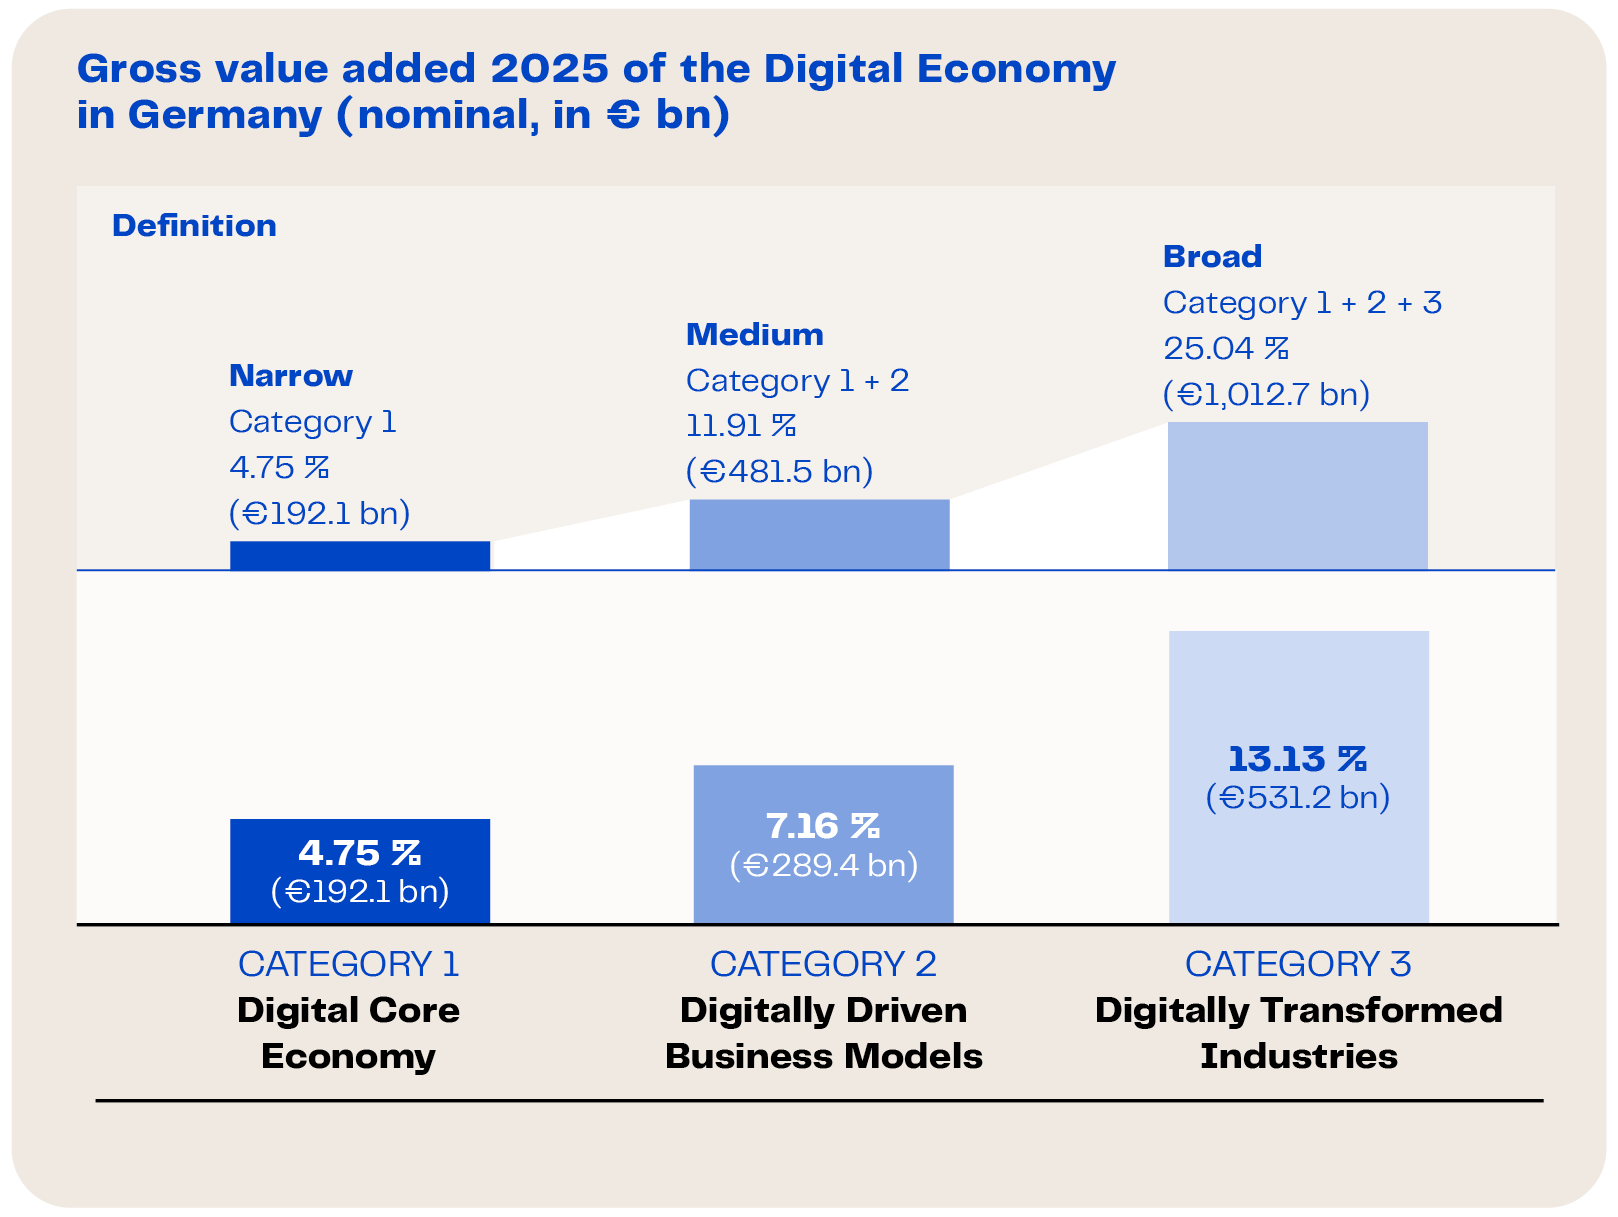
The table below summarises the Digital Economy’s contribution to German economic output, measured as gross value added (GVA). In 2025, total gross value added across all economic sectors amounted to €4.04 trillion and gross domestic product to €4.47 trillion. Weighted by size class, the Digital Economy in the broad definition – Categories 1 to 3 combined – accounts for 25.04 per cent of gross value added, or €1.01 trillion. In the narrow definition, which covers only the digital core economy, the share is 4.75 per cent, or €192 billion. Remarkably, the share of value added under the broad definition (25.04 per cent) almost exactly matches the Digital Economy’s share of all companies (24.7 per cent). The same is true of the digital core economy (4.75% of GVA and 4.4% of all companies).
Looking at the individual categories, however, the share of companies and the share of value added can still differ considerably. Category 2 (digitally driven business models) contributes comparatively little to gross value added at 7.16 per cent, or €289 billion, despite accounting for 11.6 per cent of all companies. Category 3 (digitally transformed industries) shows the reverse: its share of value added is disproportionately high at 13.13 per cent, or €531 billion, although it represents only 8.7 per cent of all companies. This gap is not a contradiction; it follows directly from what the two measures capture. A share of companies measures something different from a share of economic output: when counting companies, an online shop with two employees counts just as much as a major bank. Category 2 consists of many, often small companies, which are also concentrated in industries with comparatively low overall value added. That is why it accounts for just under 13 per cent of companies but only just over 7 per cent of value added. Category 3, by contrast, includes fewer companies, but a disproportionate number of large ones from particularly high-value industries such as banking, insurance, energy supply and manufacturing. As a result, it accounts for over 13 per cent of value added, despite making up just under 9 per cent of companies. Category 2 thus shows the breadth of the Digital Economy, Category 3 its economic weight.
The breakdown of digital value creation by economic sector is particularly revealing. In information and communication and among financial and insurance service providers, value added is almost entirely attributable to the Digital Economy, with shares of over 95 per cent. The largest absolute contributions, however, come from business service providers, at around €238 billion, and from trade, transport and hospitality, at around €207 billion. Neither is a traditionally digital sector, yet their sheer size means they contribute substantially to digital value creation. This shows that the Digital Economy now extends far beyond the traditional IT industry.
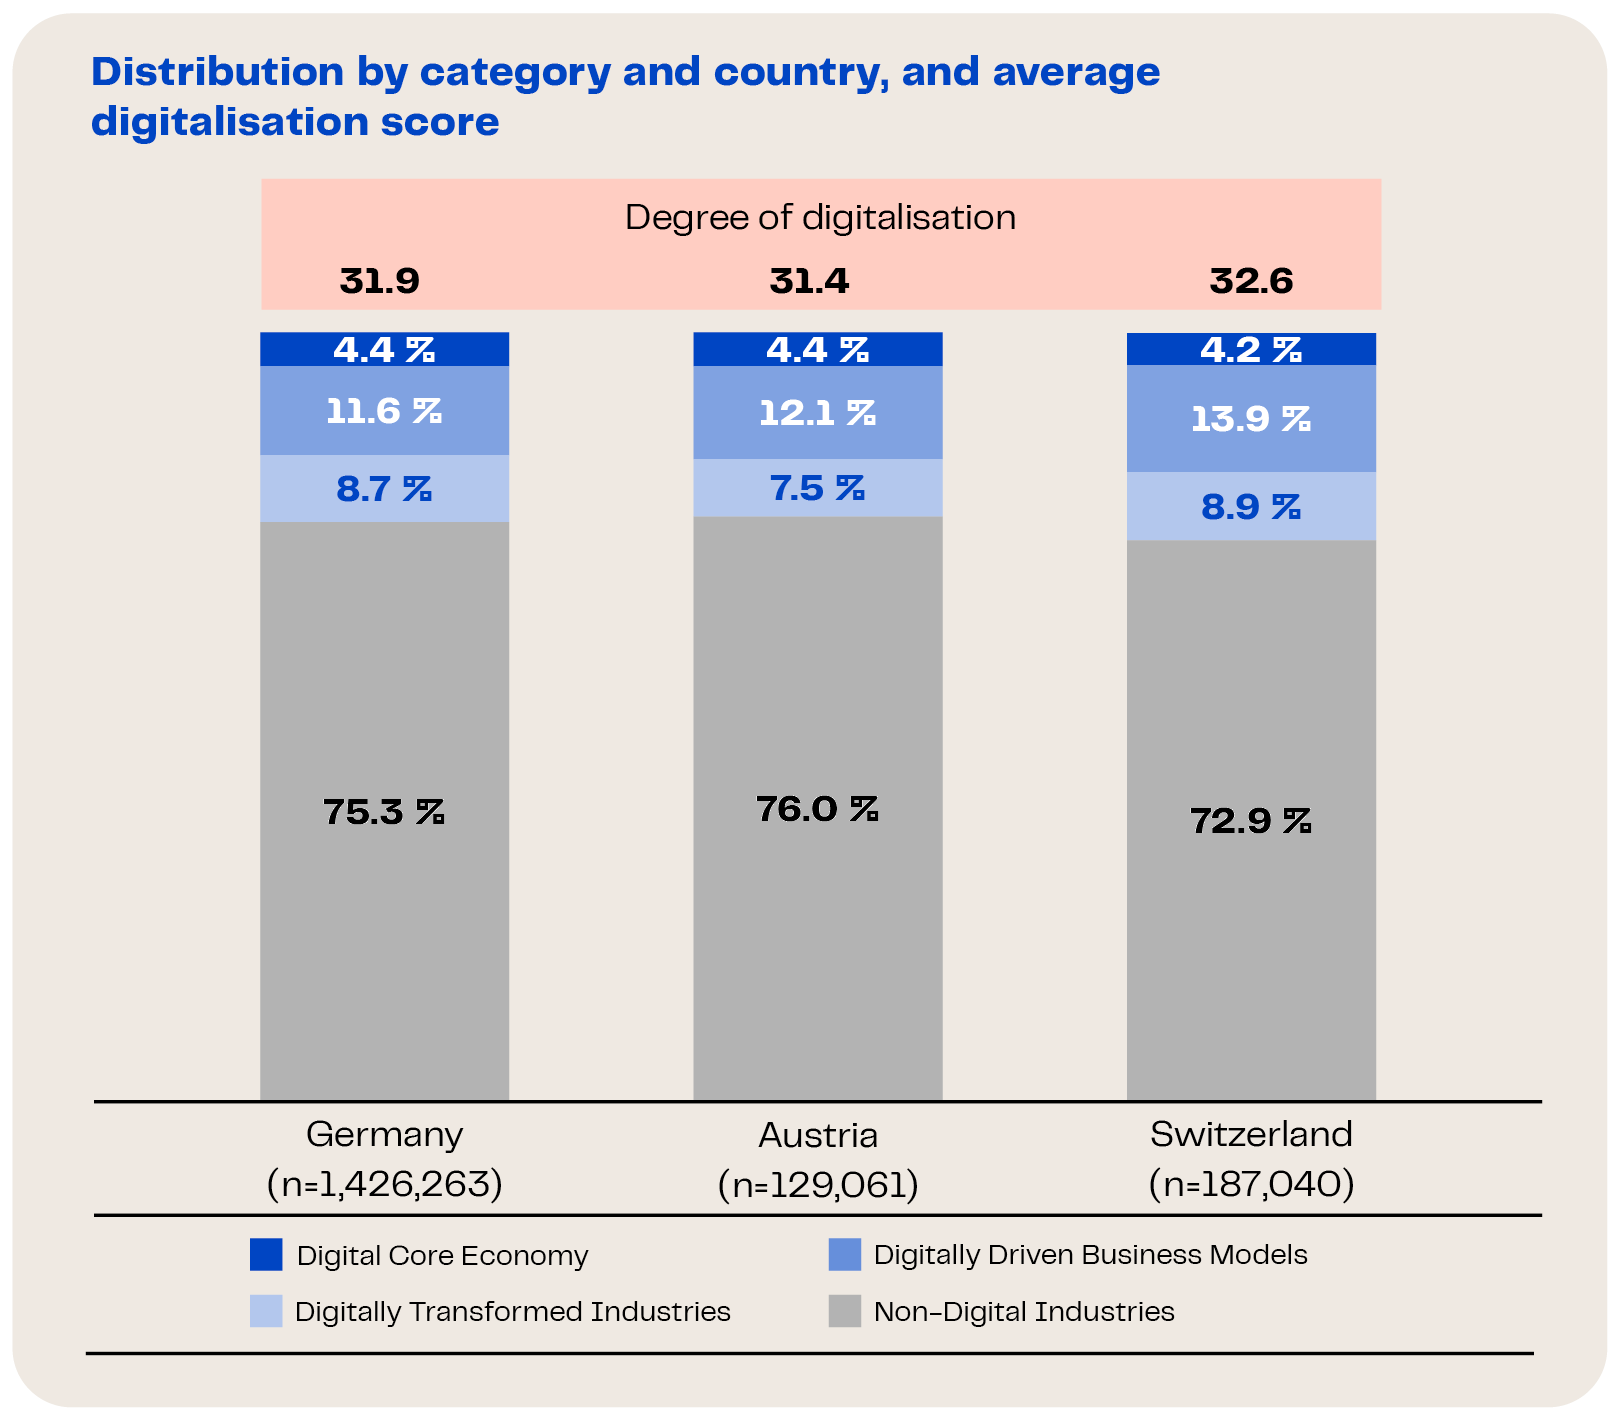
The final comparison looks at Germany, Austria and Switzerland side by side. This is possible because the webAI methodology can be applied worldwide. It is again based on ISTARI’s Global Organization Index (GOI), which covers organisations around the globe and allows cross-country analysis and benchmarking on a consistent methodological basis. As the figure shows, the three countries differ only marginally – in the share of the Digital Economy, in the distribution across categories and in the average degree of digitalisation. Switzerland has the highest share of Digital Economy companies and the highest degree of digitalisation. Overall, this suggests that the three countries, whose economic structures are already very similar, are also comparably positioned when it comes to the Digital Economy. Since the GOI covers every country in the world, the same approach could be extended to other European and non-European countries in future, providing further context and benchmarks.
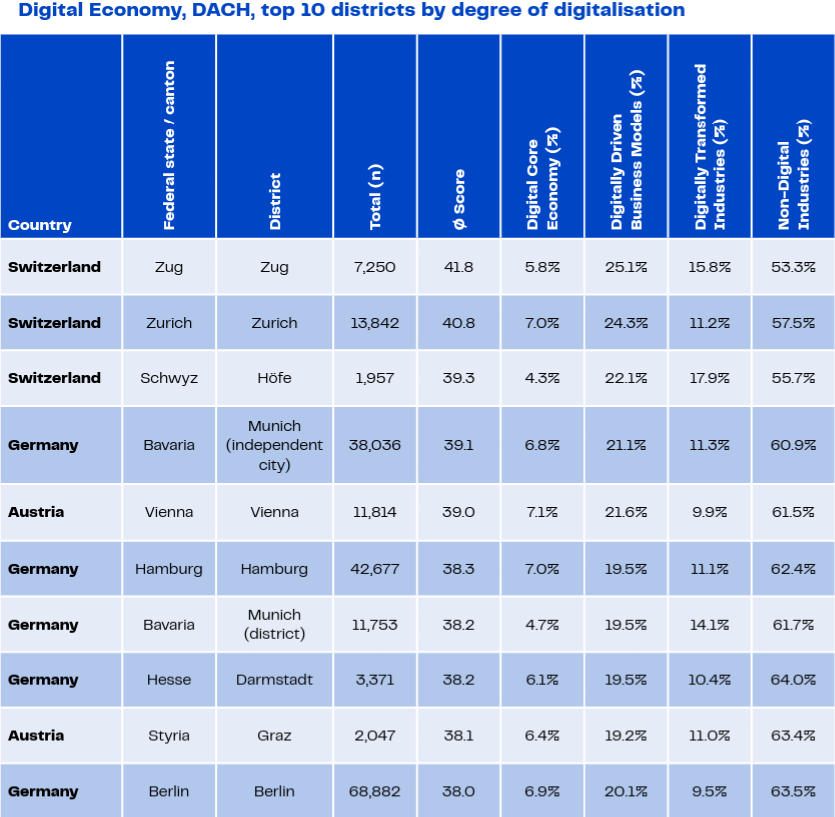
A closer look at the regions confirms this picture. The map below shows the average degree of digitalisation for each district across all three countries. Across borders, digitalisation follows much the same pattern as within Germany: high scores are concentrated in metropolitan areas, while rural regions lag behind. The national borders are barely visible on the map, underlining the structural similarity of the DACH region. All three countries feature among the ten regions with the highest degree of digitalisation (see appendix). The Swiss cantons of Zug and Zurich lead with average scores of 41.8 and 40.8, followed by the Höfe district in the canton of Schwyz. Only then come the strongest German and Austrian regions – Munich and Hamburg in Germany, Vienna and Graz in Austria – each scoring around 38 to 39. Notably, the leading Swiss regions owe their high degree of digitalisation not primarily to a larger digital core (digital core economy), but above all to a high share of digitally driven business models: in Zug and Zurich, around a quarter of all companies fall into this category – considerably more than in the leading German regions.
Regional distribution (interactive view)
Our innovative approach allows us to show every region in detail. Find your region in our interactive view!
A
- Ahrweiler
- Aichach-Friedberg
- Alb-Donau-Kreis
- Altenburger Land
- Altenkirchen (Westerwald)
- Altmarkkreis Salzwedel
- Altötting
- Alzey-Worms
- Amberg
- Amberg-Sulzbach
- Ammerland
- Anhalt-Bitterfeld
- Ansbach
- Ansbach (Kreisfreie Stadt)
- Aschaffenburg
- Aschaffenburg (Kreisfreie Stadt)
- Augsburg
- Augsburg (Kreisfreie Stadt)
- Aurich
B
- Bad Dürkheim
- Bad Kissingen
- Bad Kreuznach
- Bad Tölz-Wolfratshausen
- Baden-Baden
- Bamberg
- Bamberg (Kreisfreie Stadt)
- Barnim
- Bautzen
- Bayreuth
- Bayreuth (Kreisfreie Stadt)
- Berchtesgadener Land
- Bergstraße
- Berlin
- Bernkastel-Wittlich
- Biberach
- Bielefeld
- Birkenfeld
- Bochum
- Bodensee
- Bodenseekreis
- Bonn
- Borken
- Bottrop
- Brandenburg an der Havel
- Braunschweig
- Breisgau-Hochschwarzwald
- Bremen
- Bremerhaven
- Burgenlandkreis
- Böblingen
- Börde
C
D
E
F
G
H
- Hagen
- Halle (Saale)
- Hamburg
- Hameln-Pyrmont
- Hamm
- Harburg
- Harz
- Havelland
- Haßberge
- Heidekreis
- Heidelberg
- Heidenheim
- Heilbronn
- Heilbronn (Stadtkreis)
- Heinsberg
- Helmstedt
- Herford
- Herne
- Hersfeld-Rotenburg
- Herzogtum Lauenburg
- Hildburghausen
- Hildesheim
- Hochsauerlandkreis
- Hochtaunuskreis
- Hof
- Hof (Kreisfreie Stadt)
- Hohenlohekreis
- Holzminden
- Höxter
K
L
M
- Magdeburg
- Main-Kinzig-Kreis
- Main-Spessart
- Main-Tauber-Kreis
- Main-Taunus-Kreis
- Mainz
- Mainz-Bingen
- Mannheim
- Mansfeld-Südharz
- Marburg-Biedenkopf
- Mayen-Koblenz
- Mecklenburgische Seenplatte
- Meißen
- Memmingen
- Merzig-Wadern
- Mettmann
- Miesbach
- Miltenberg
- Minden-Lübbecke
- Mittelsachsen
- Märkisch-Oderland
- Märkischer Kreis
- Mönchengladbach
- Mühldorf am Inn
- Mülheim an der Ruhr
- München
- München (Kreisfreie Stadt)
- Münster
N
- Neckar-Odenwald-Kreis
- Neu-Ulm
- Neuburg-Schrobenhausen
- Neumarkt in der Oberpfalz
- Neumünster
- Neunkirchen
- Neustadt a.d. Aisch-Bad Windsheim [1]
- Neustadt a.d. Aisch-Bad Windsheim [2]
- Neustadt an der Waldnaab
- Neustadt an der Weinstraße
- Neuwied
- Nienburg (Weser)
- Nordfriesland
- Nordhausen
- Nordsachsen
- Nordwestmecklenburg
- Northeim
- Nürnberg
- Nürnberger Land
O
- Oberallgäu
- Oberbergischer Kreis
- Oberhausen
- Oberhavel
- Oberspreewald-Lausitz
- Odenwaldkreis
- Oder-Spree
- Offenbach
- Offenbach am Main
- Oldenburg
- Oldenburg (Kreisfreie Stadt)
- Olpe
- Ortenaukreis
- Osnabrück
- Osnabrück (Kreisfreie Stadt)
- Ostalbkreis
- Ostallgäu
- Osterholz
- Osterode am Harz
- Ostholstein
- Ostprignitz-Ruppin
P
R
- Rastatt
- Ravensburg
- Recklinghausen
- Regen
- Regensburg
- Regensburg (Kreisfreie Stadt)
- Region Hannover
- Regionalverband Saarbrücken
- Rems-Murr-Kreis
- Remscheid
- Rendsburg-Eckernförde
- Reutlingen
- Rhein-Erft-Kreis
- Rhein-Hunsrück-Kreis
- Rhein-Kreis Neuss
- Rhein-Lahn-Kreis
- Rhein-Neckar-Kreis
- Rhein-Pfalz-Kreis
- Rhein-Sieg-Kreis
- Rheingau-Taunus-Kreis
- Rheinisch-Bergischer Kreis
- Rhön-Grabfeld
- Rosenheim
- Rosenheim (Kreisfreie Stadt)
- Rostock
- Rostock (Kreisfreie Stadt)
- Rotenburg (Wümme)
- Roth
- Rottal-Inn
- Rottweil
S
- Saale-Holzland-Kreis
- Saale-Orla-Kreis
- Saalekreis
- Saalfeld-Rudolstadt
- Saarlouis
- Saarpfalz-Kreis
- Salzgitter
- Salzlandkreis
- Schaumburg
- Schleswig-Flensburg
- Schmalkalden-Meiningen
- Schwabach
- Schwalm-Eder-Kreis
- Schwandorf
- Schwarzwald-Baar-Kreis
- Schweinfurt
- Schweinfurt (Kreisfreie Stadt)
- Schwerin
- Schwäbisch Hall
- Segeberg
- Siegen-Wittgenstein
- Sigmaringen
- Soest
- Solingen
- Sonneberg
- Speyer
- Spree-Neiße
- St. Wendel
- Stade
- Starnberg
- Steinburg
- Steinfurt
- Stendal
- Stormarn
- Straubing
- Straubing-Bogen
- Stuttgart
- Städteregion Aachen
- Suhl
- Sächsische Schweiz-Osterzgebirge
- Sömmerda
- Südliche Weinstraße
- Südwestpfalz
V
W
- Waldeck-Frankenberg
- Waldshut
- Warendorf
- Wartburgkreis
- Weiden in der Oberpfalz
- Weilheim-Schongau
- Weimar
- Weimarer Land
- Weißenburg-Gunzenhausen
- Werra-Meißner-Kreis
- Wesel
- Wesermarsch
- Westerwaldkreis
- Wetteraukreis
- Wiesbaden
- Wilhelmshaven
- Wittenberg
- Wittmund
- Wolfenbüttel
- Wolfsburg
- Worms
- Wunsiedel im Fichtelgebirge
- Wuppertal
- Würzburg
- Würzburg (Kreisfreie Stadt)
What are the conclusions?
The study shows that the Digital Economy is a key economic driver in and for Germany. It is not one industry among many, but a cross-cutting economic reality that runs through every industry and sector.
It follows that digital policy should finally be recognised for what it is:
- SME policy.
- Labour market policy.
- Economic location policy.
- Economic policy.